- Textastic for iOS
-
 Ideas
Ideas

JavaScript debug console
Answer

This app is great. Thank you.


i'm really sorry about my english! :D
@a blach: this might be interesting for you: http://atnan.com/blog/2011/11/17/enabling-remote-debugging-via-private-apis-in-mobile-safari/
i dont understand anything about ios developing but this sounds interesting.
@all the others: we can use the full-featured developer tools from firefox, chrome and safari now: http://phonegap.github.com/weinre/Home.html


Seems nobody understand the problem... you only can activate Firebug Lite after the website has loaded. Because of that FL is simply unusable because it does not catch the most important stage of the HTML application. :(
Instead of using the feature in Textastic, you can reference Firebug Lite directly in your html file as described at http://getfirebug.com/firebuglite#Stable:
<script type="text/javascript" src="https://getfirebug.com/firebug-lite.js"></script>
This way it will be loaded with the web page.
As Dave pointed out above, you also need to add <html debug="true"> to your html document when you do that.
Thanks finally I can use it! :D
Any chance that textastic can inject the firebug lite option after the html node? I mean this works now but an automatically solution would be cool. Are there license problems or why do we need to download it every time we preview a page ?
Greets BlackCat
Well, you can download Firebug locally and reference the local copy. I didn't include it in Textastic so that it automatically uses the latest version.
I don't think it's feasible to automatically inject this - I think that would be error-prone when the html file has a format that's not anticipated.

I have the debug="true" entry on my HTML tag. I also have added the "#startOpened" parameter to the script tag. But I still can't get it to open the debug window when referencing the file locally.
FYI, I'm using Textastic to work with Github files, accessed via Working Copy. Is that part of the problem? Firebug Lite (when it does work) also gives me the dreaded "Access to restricted URI denied error", when I try to inspect any of these local files with it. Maybe because they're not really local when accessed through Working Copy?
Also, Textastic has only access to this single file in Working Copy and not other files in the same folder in Working Copy.

Did you try to reference it directly from your HTML as the first script as described on the Firebug Lite site? http://getfirebug.com/
There are certain limits even then. Since Firebug Lite itself is written in JavaScript, it might not be able to catch errors if the site has syntax errors in JavaScript code.

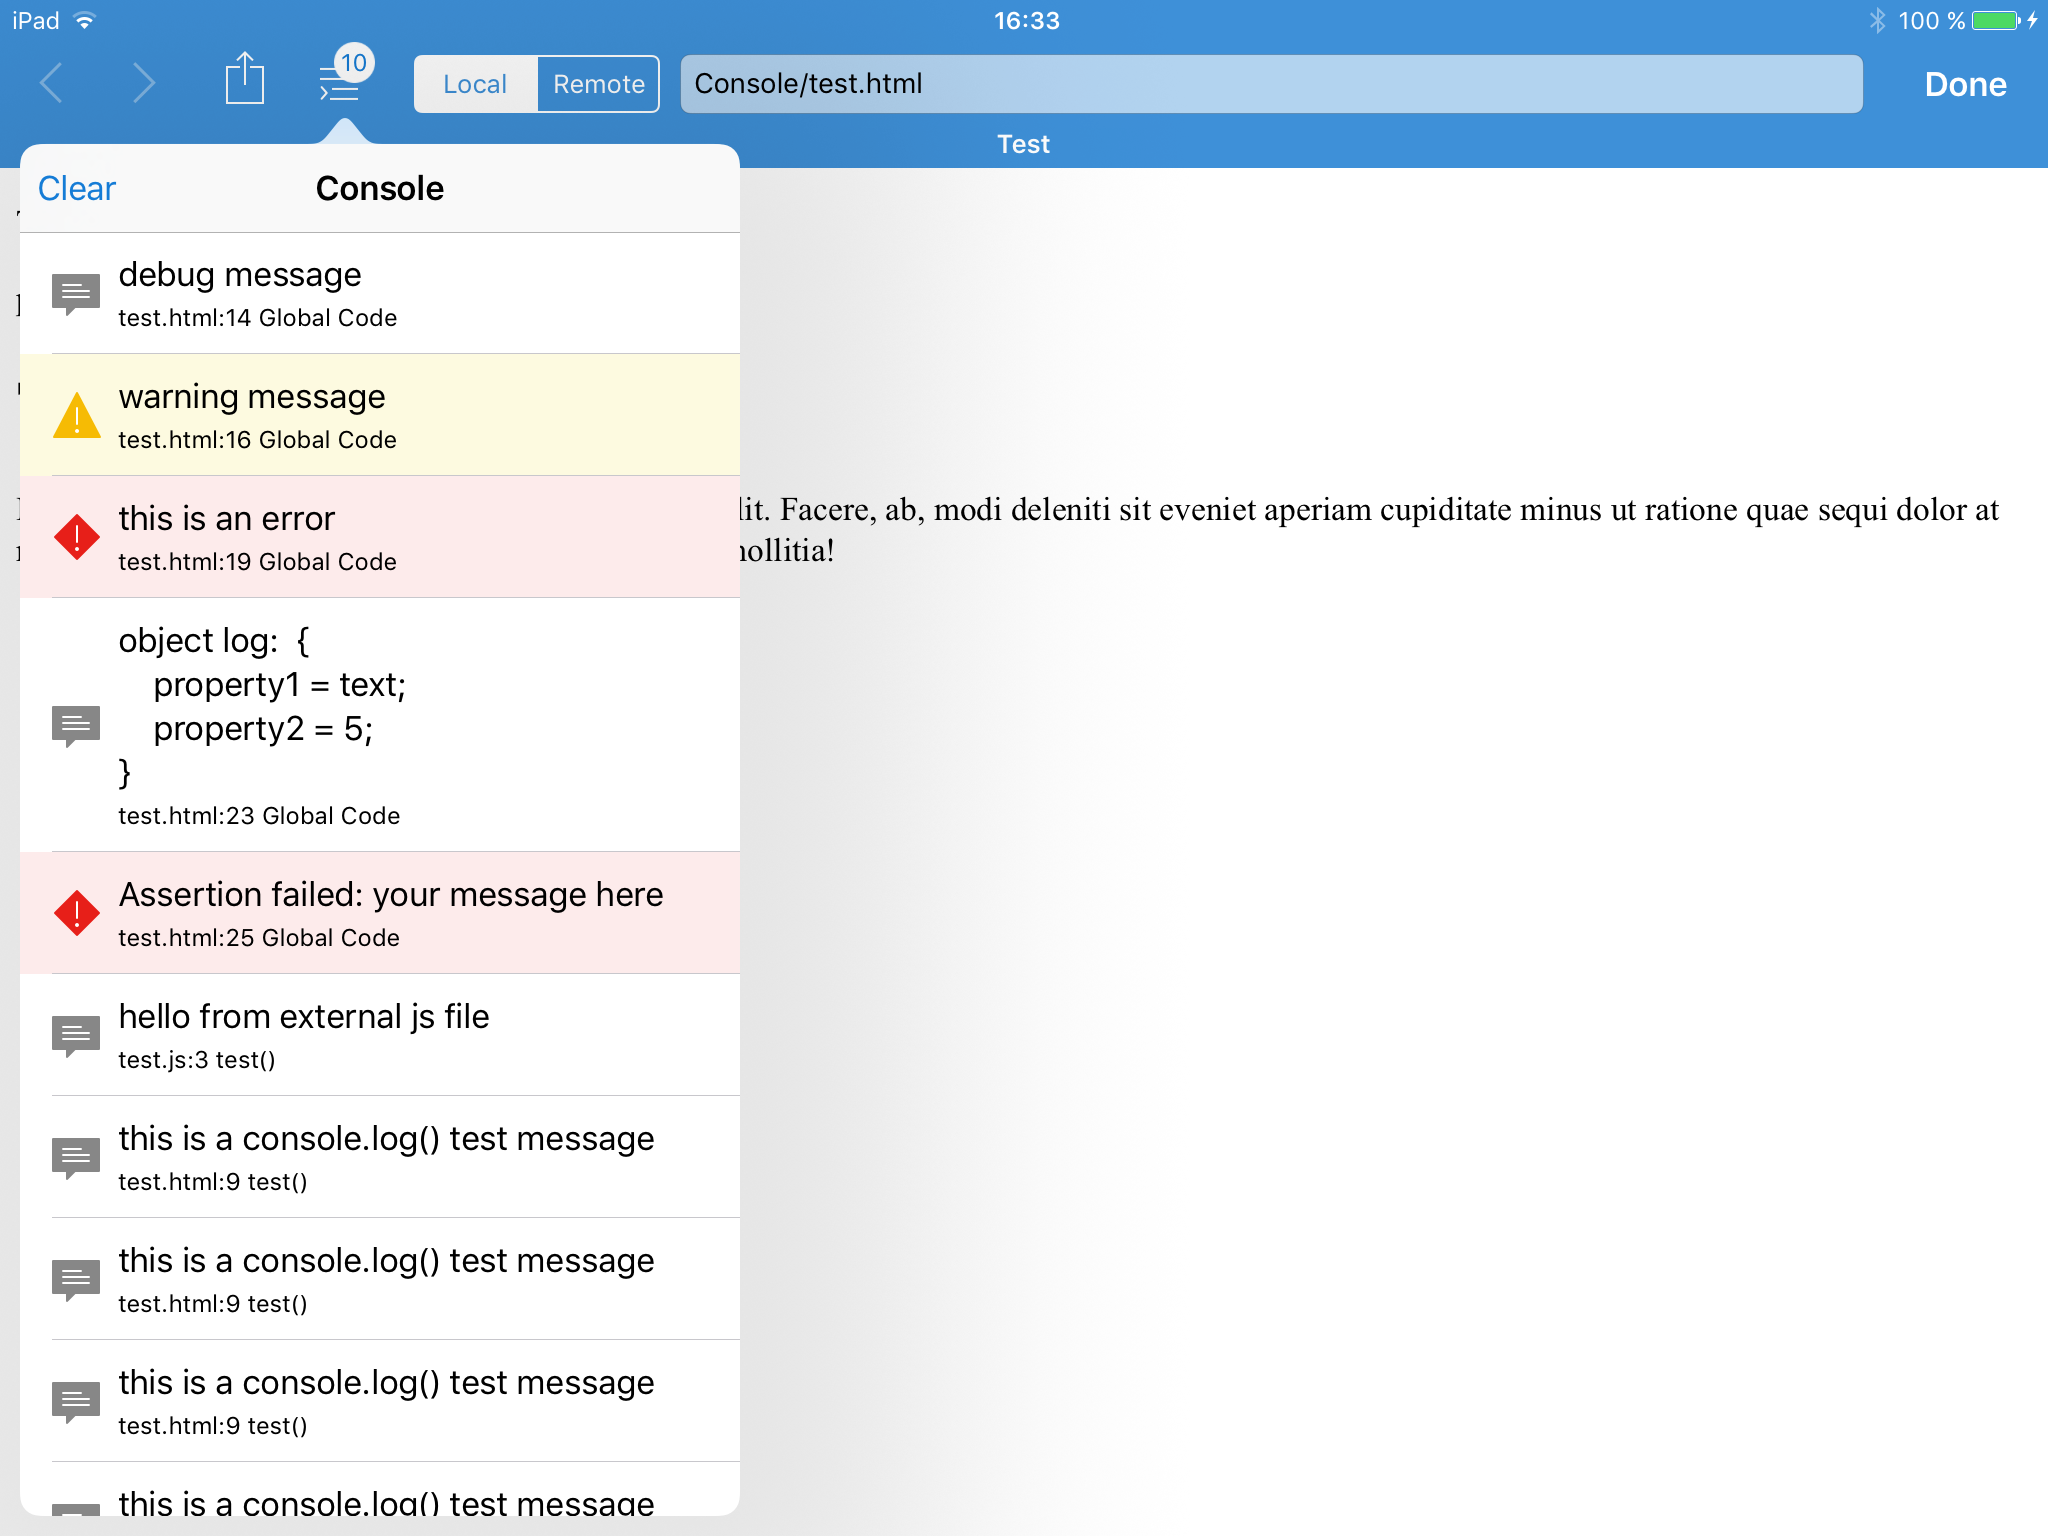
Textastic 6.3 adds a new JavaScript console that can show errors in your JavaScript code and allows you to log custom messages using the JavaScript Console object (for example by calling the console.log() method).

You can invoke it by tapping on the console button in the toolbar on the preview screen. Here is a screenshot:

I’m trying to test a simple console.log statement, but nothing is showing up in the console. What am I doing wrong?
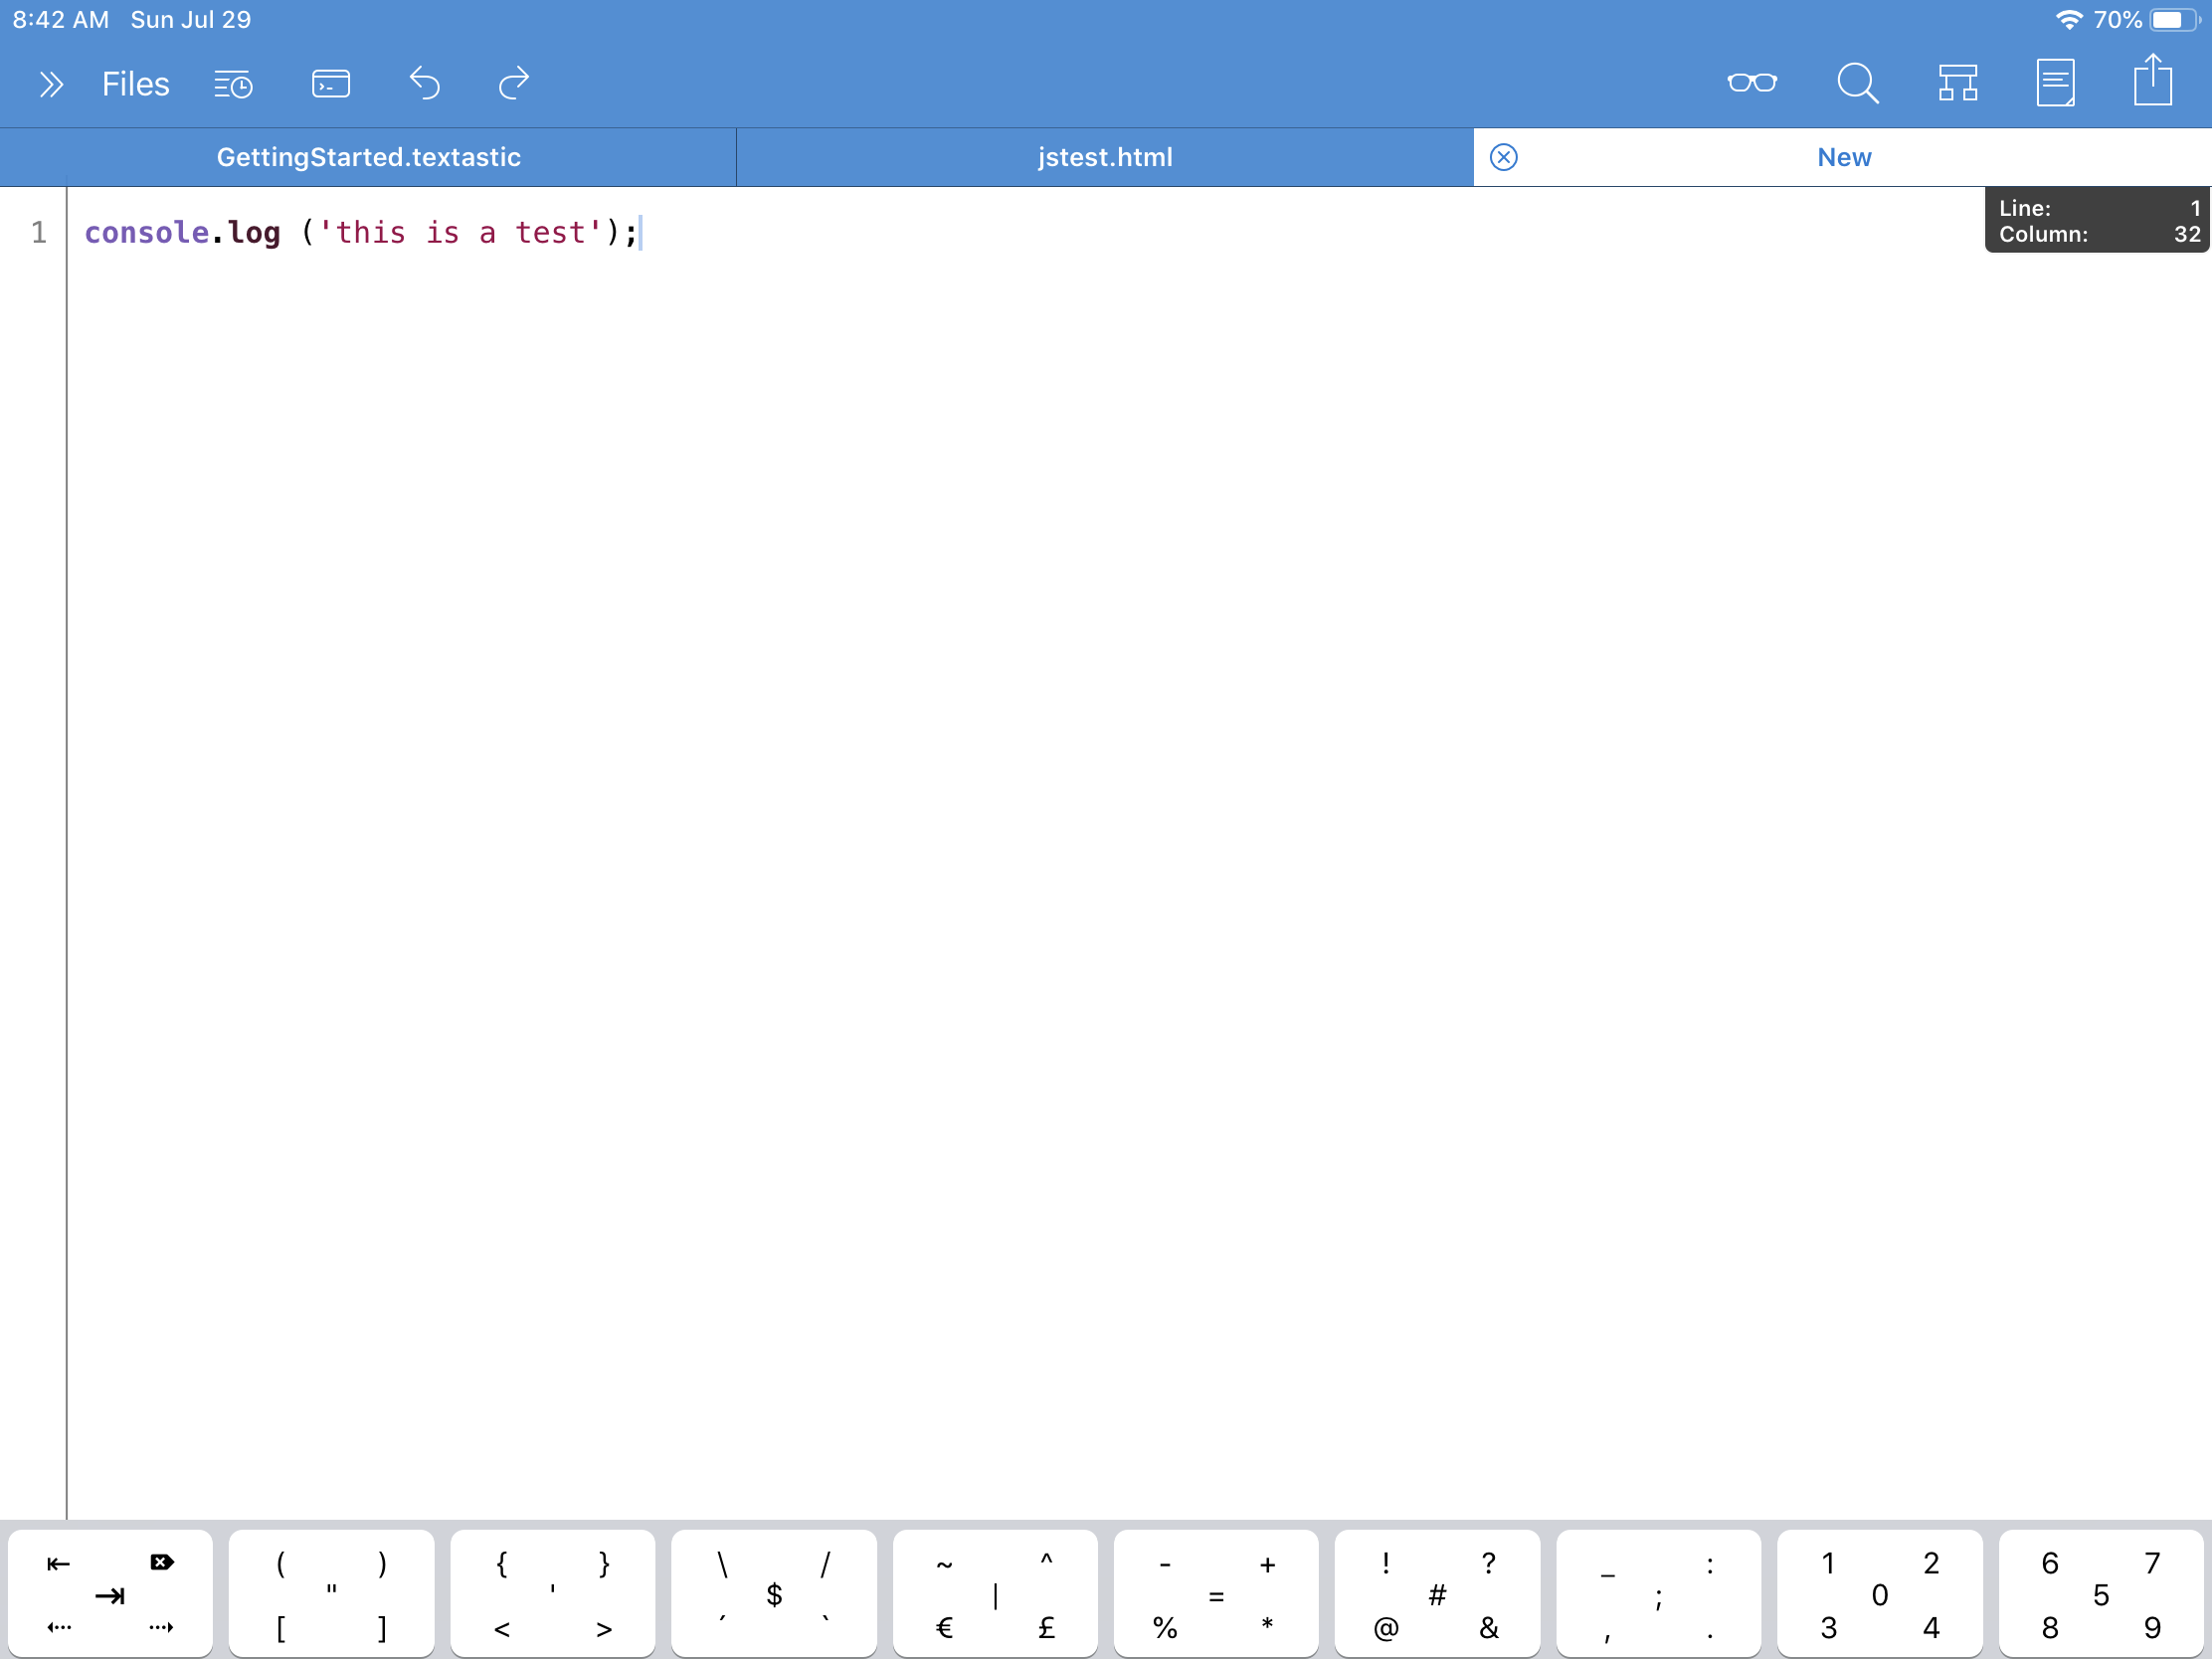
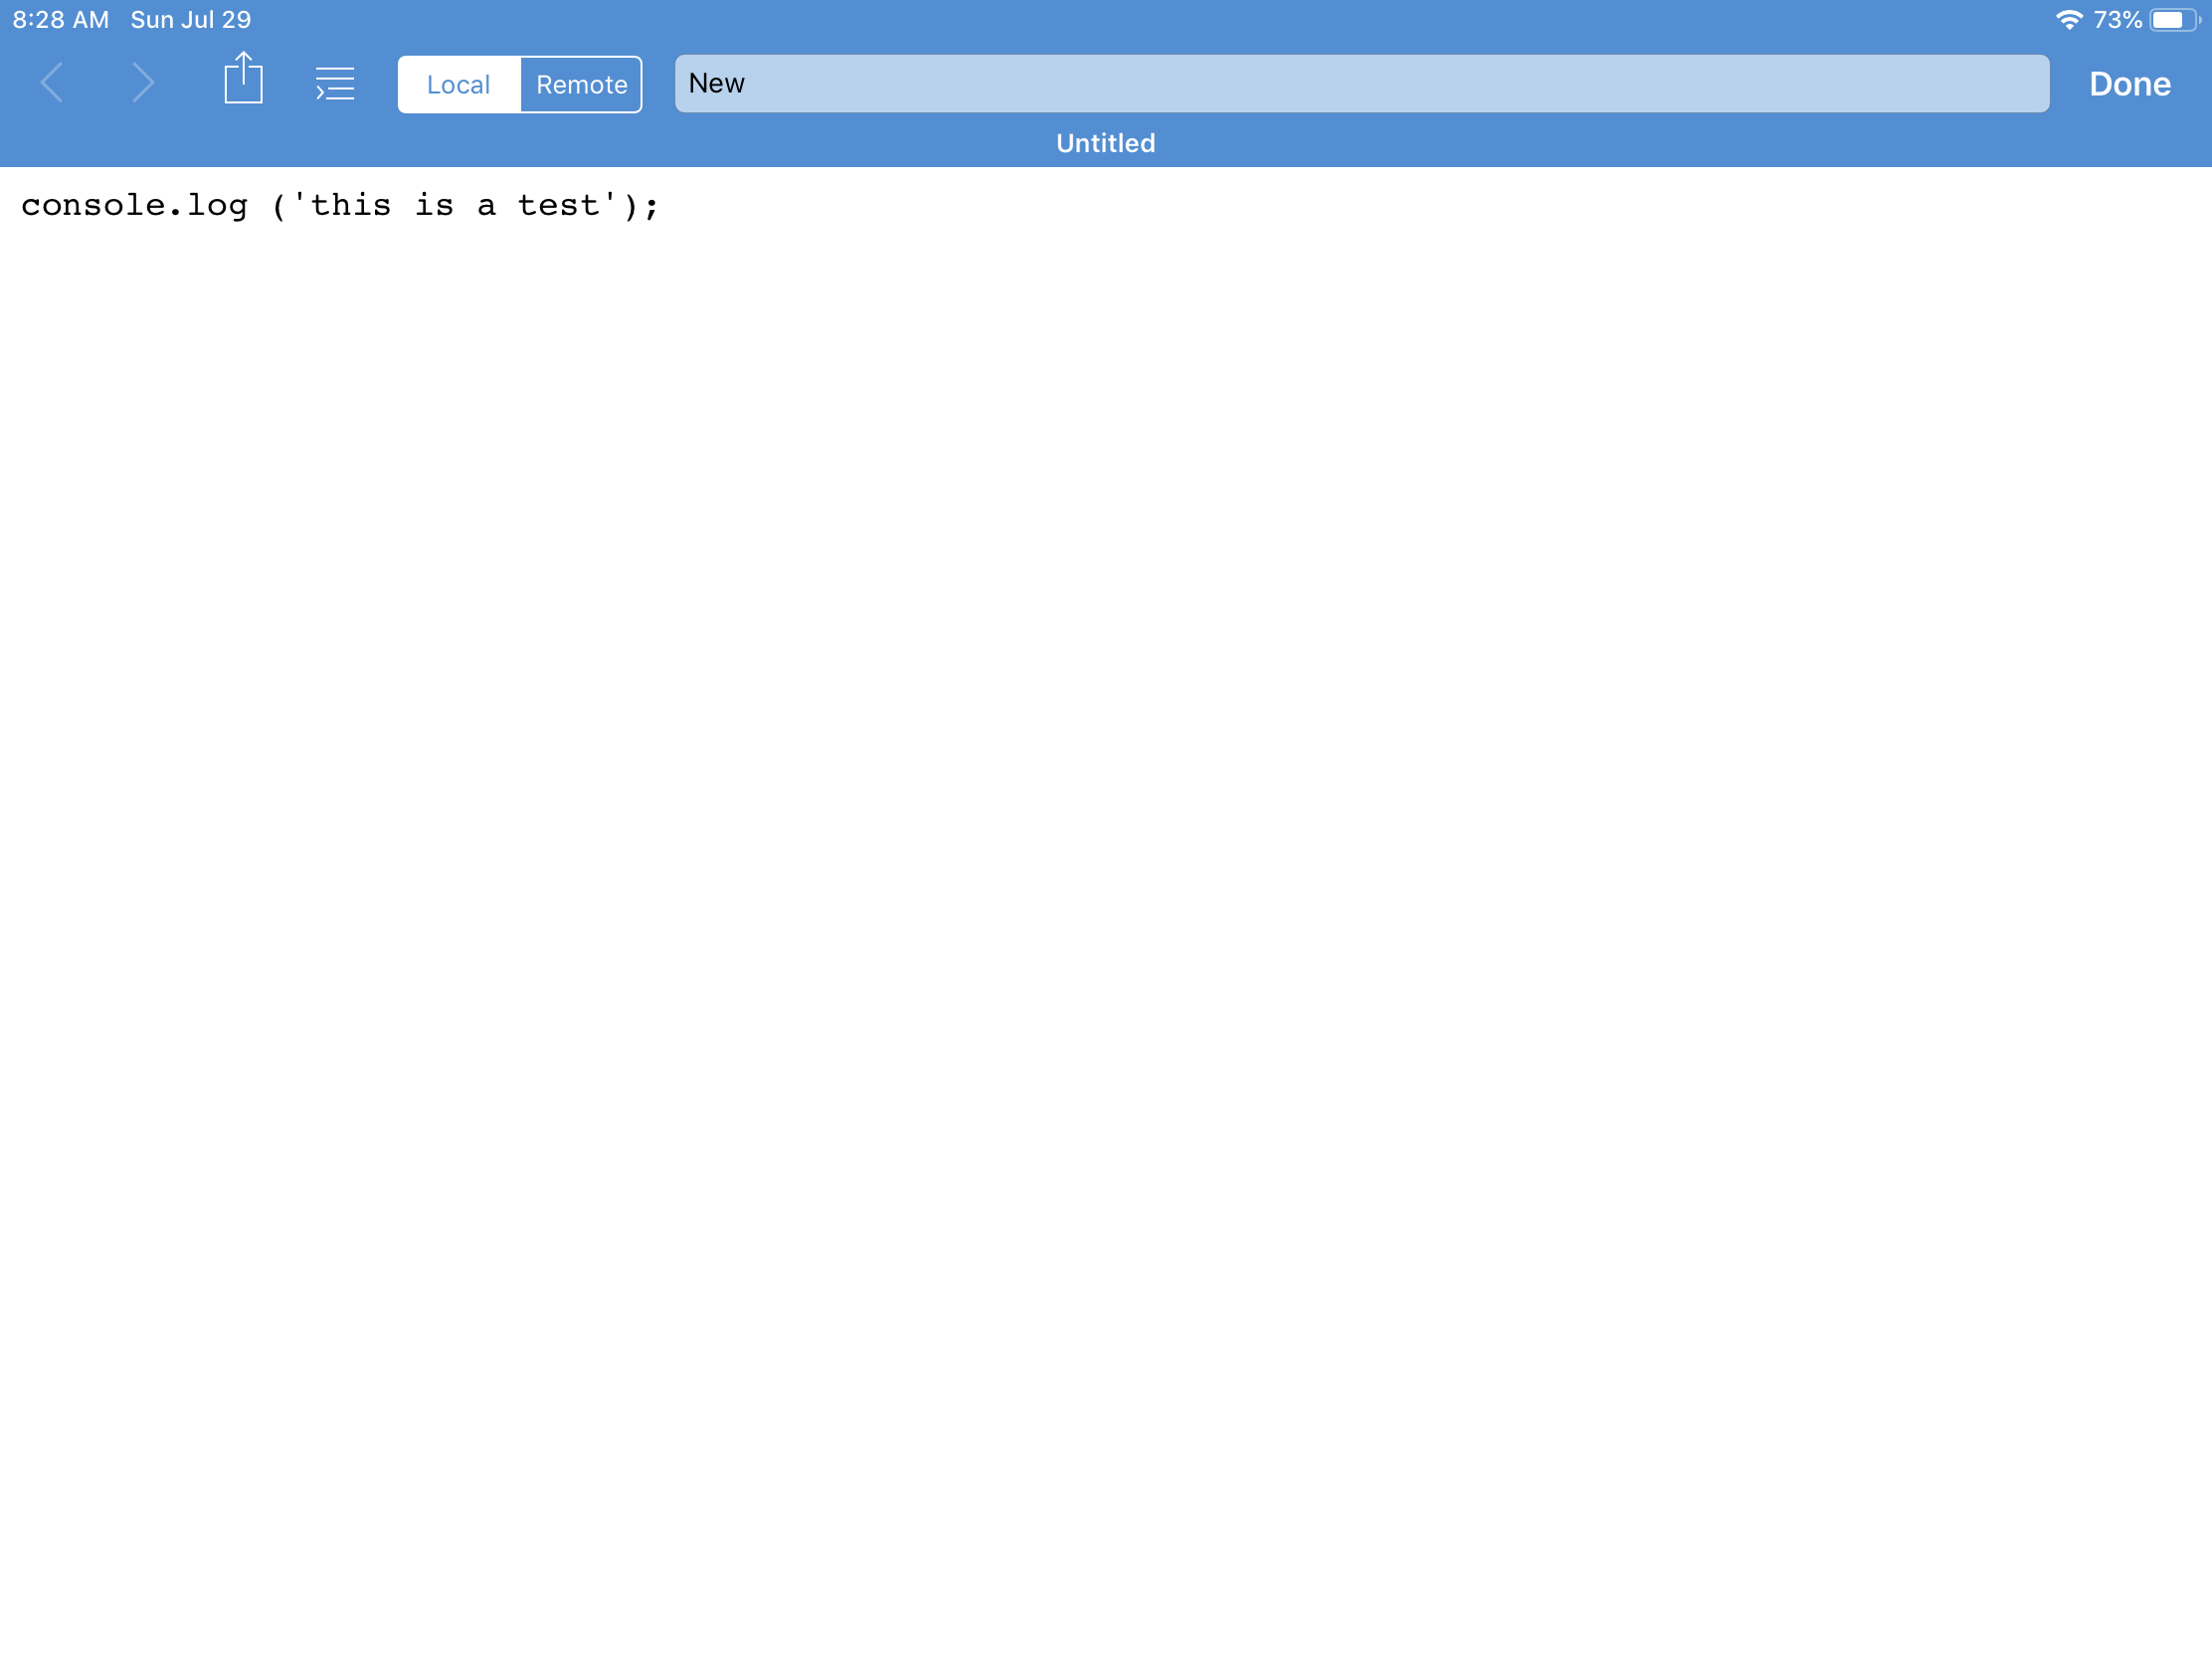
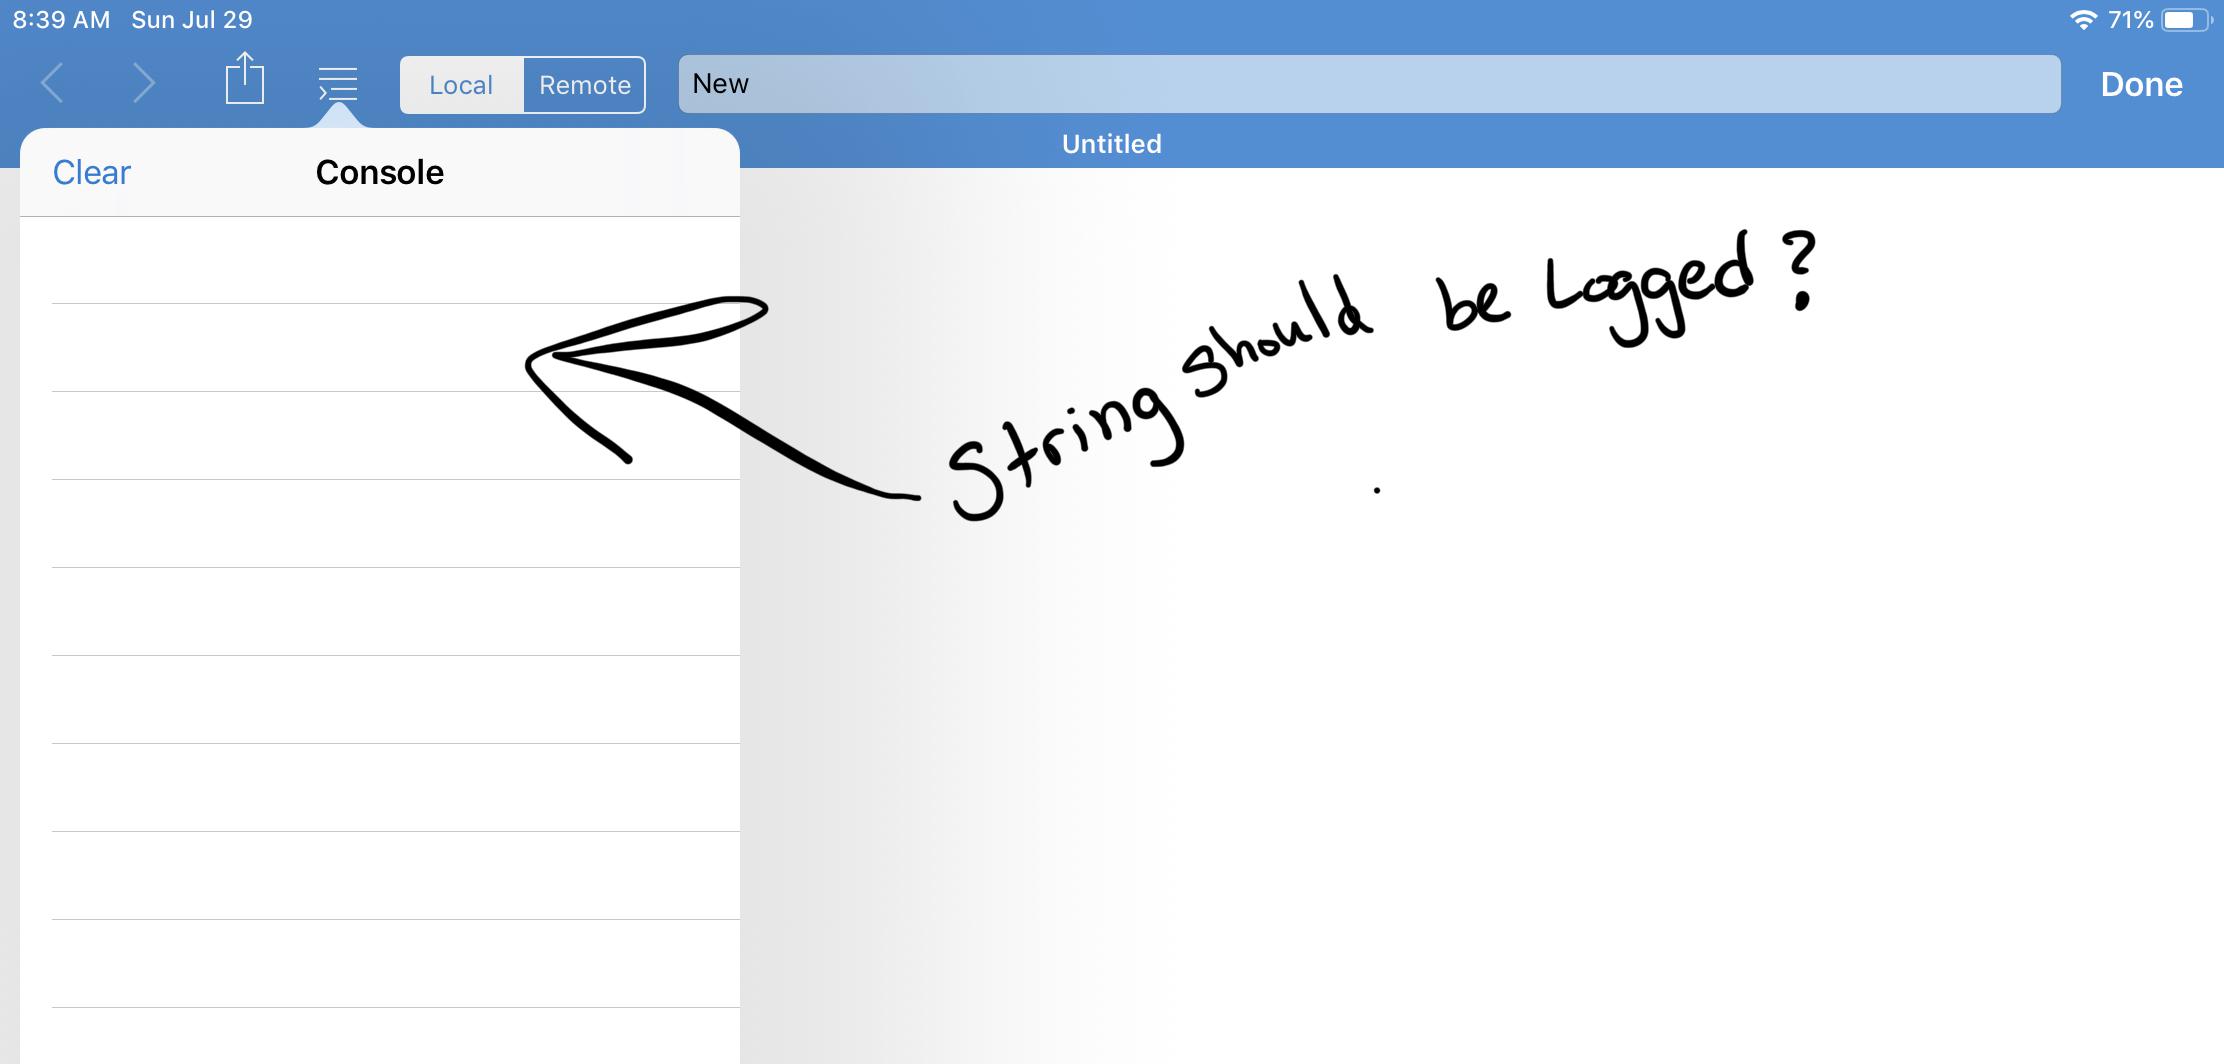
The JavaScript code must be either inside a script tag in a .html file or if you want to have it in a separate .js file, you need to reference that file from a .html file. Then you need to show the preview of that .html file to make the console.log statement work.
So for example this would work:
<!DOCTYPE HTML>
<html>
<head>
<meta charset="utf-8">
<title>Console Test</title>
<script>
console.log('this is a test');
</script>
</head>
<body>
</body>
</html>

I am using Textastic for iPad and cannot get anything to log to the console. I tried the above solution by copying and pasting into an html document and it worked. However, if I type the exact same thing and preview it, I get 'SyntaxError: Invalid character '\u201c'. What am I doing wrong here???
Customer support service by UserEcho

Textastic 6.3 adds a new JavaScript console that can show errors in your JavaScript code and allows you to log custom messages using the JavaScript Console object (for example by calling the console.log() method).